SAP BW is not required for the graphical representation of key figures in OPRA reports. The standard SAP ERP system is sufficient. The OPRA standard reports can be extended with individual key figures and overviews.
Dashboard as an introduction
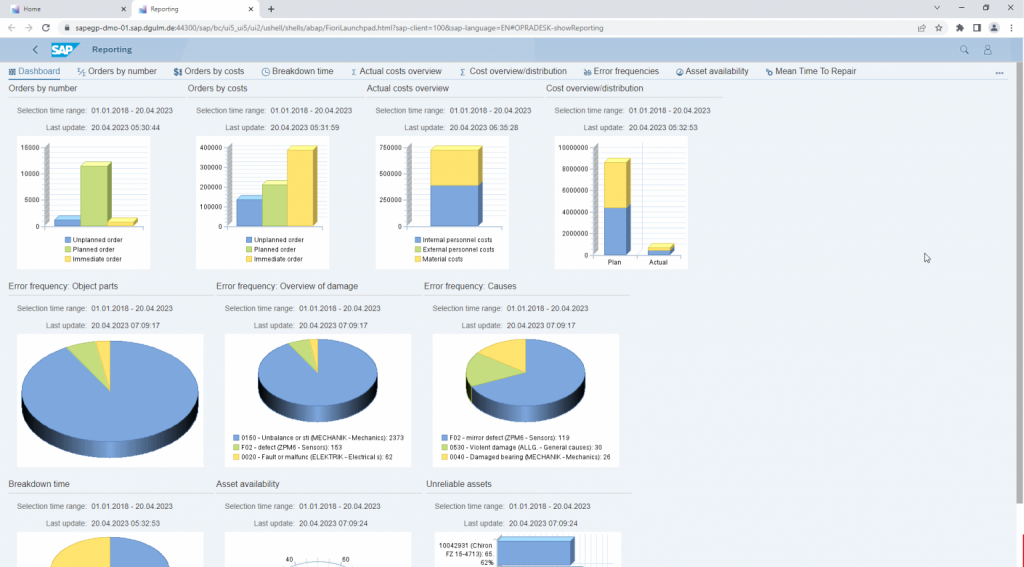
An initial overview is provided by the individually configurable dashboard, which provides graphic information on the most important key figures. These key figures are calculated daily in the background, which also enables the highest performance for the evaluation of historical data. The dashboard can be used to jump directly to the respective detailed report. For further processing of the data, an export to Excel is possible.
With OPRA, maintenance in SAP can finally be evaluated.